Litecoin (LTC/USD)

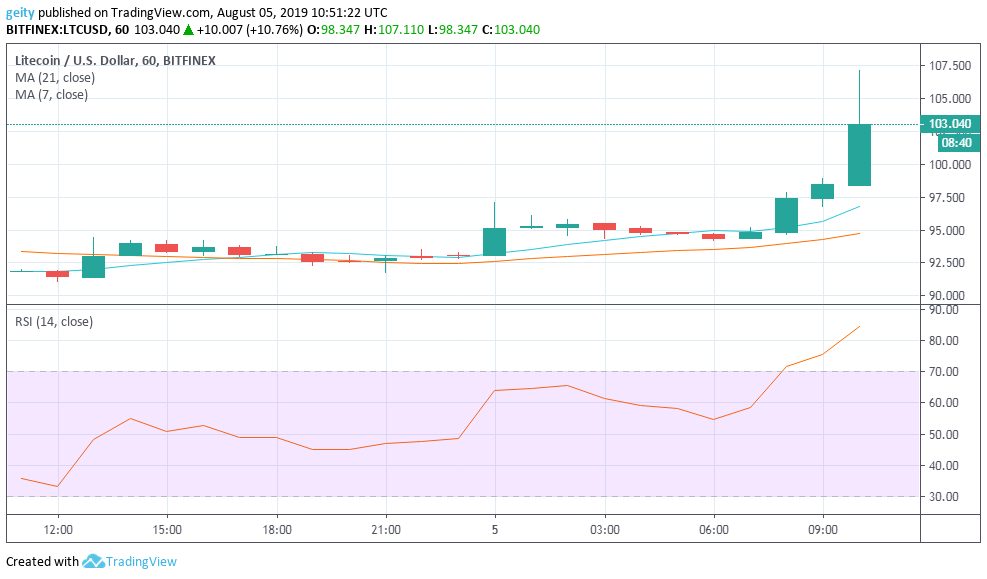
LTC/USD pair exhibited a bullish outlook on an intraday chart. LTC/USD began trading yesterday at $91.837 and is now trading at $103.040 that interprets to an intraday gain of 10.9%. The upsurge was seen after a long-term period of consolidation that corrected gains between the critical support level $92.156 and resistance level of $95.724.
Additionally, a breakout later followed that pushed the price up to rally at a high of $107.110 before a slight price rejection that dipped the price to $103.040. The RSI indicator also signaled a bearish pressure having recorded gains since it climbed from almost below the oversold area (level 30) to trade above the overbought territory (level 70).
The RSI is currently heading Northway, which signals an increase in investor’s sentiments that led to increase in buyouts.
Forecast
At the moment, both the RSI and moving averages indicators point at a further bullish momentum. The RSI indicator is tending north, and the 7-day MA is currently gravitating above the 21-day MA and could set next breakout targets on $108.
Binance (BNB/USD)

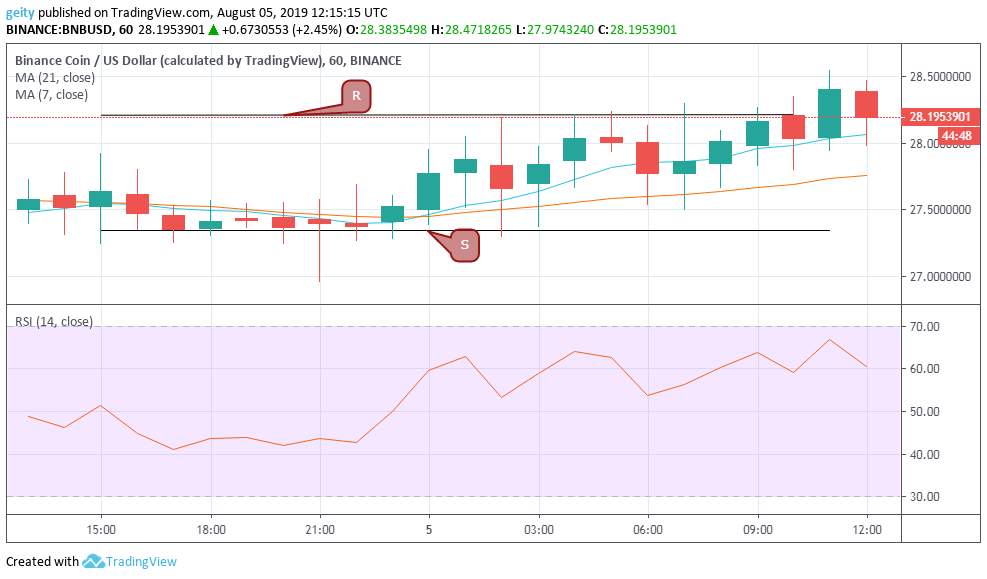
BNB/USD pair, on the other hand, is up by 2.18% throughout the intraday. BNB began the session trading at $27.5795 where it later surged upwards to trade at the current price of $28.1954. The pair’s price saw a short-term period of consolidation below the critical support level at $27.3445.
The price also showed recovery since the RSI indicator climbed upwards steadily to trade at level 66 that signaled buyers dominated the market momentum. This defined the fundamental resistance level at $28.2069, which, was later breached severally. However, both the resistance level and support level was tested.
The RSI indicator is at the moment heading south that signaled reduce confidence in the coin by the investors that lead to increase in sell-offs.
Forecast
The 7 day MA is currently above the 21 day MA that signals more bull run. Additionally, resistance level $28.2069 has been broken, which showed a high probability of further upward rally. New targets should be set at $29.0000.
EOS/USD

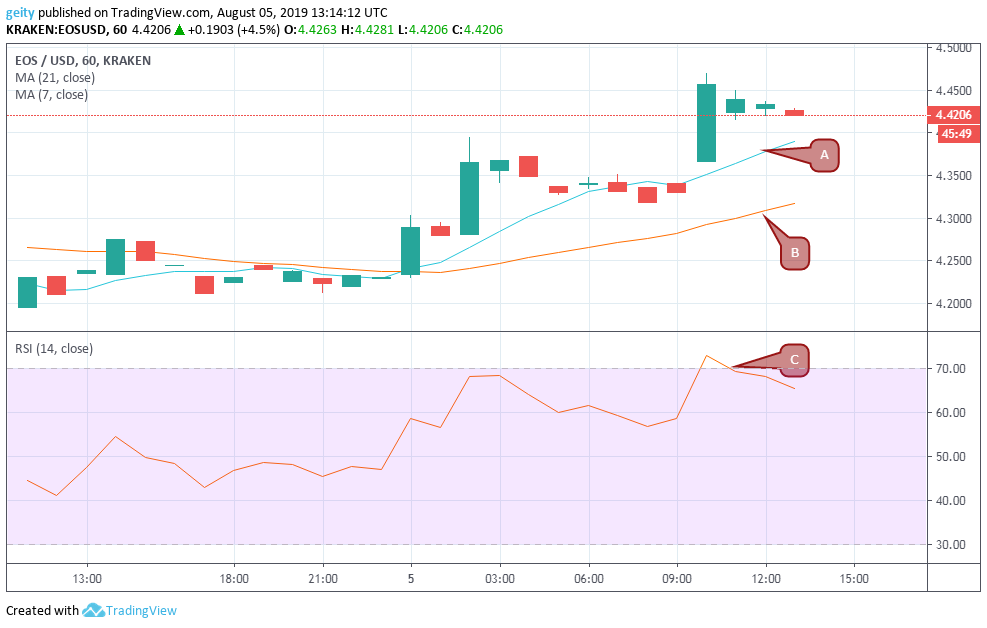
EOS/USD pair also experienced a massive recovery after consolidating below support level $4.2126 that was followed by a breakout that pushed the price up to a high of $4.3945. The support level was also upended to rally at $4.3174, followed by a sharp upward rally that closed at $4.4569 before embarking to a steady flow.
The bullish pressure seemed to have been buttressed by the 7day MA (A) that is currently above the 21 day MA(A) which indicates a continuous bullish momentum. EOS is up by 3.3%, having moved from $4.2747 to trade at $4.4206. The RSI indicator (C) was seen heading south that also signaled to reduce in buyouts.
Forecast
The 7 day MA is at press time trading above the 21-day MA, this indicates further bullish rally. New target should be set at $4.60.


