
 And Binance Coin (BNB) Price Analysis And Forecast")
Cardano (ADA/USD)


On an intraday chart, ADA/USD pair has been on a sideways trend that faced resistance level at $0.05772 and support level at $0.05547. Despite the sideways move, the pair’s price succumbed a bearish pressure that was bolstered by the 21 day MA (A) that is currently above the 7 day MA (B).
ADA began trading at $0.05742 and is now trading at $0.05696 that translates to a down surge of 2.5% throughout the intraday. The RSI indicator has also confirmed the southward move since it moved from a high of 58 to almost below the oversold zone before gaining momentum. The RSI indicator (C) is at the moment heading north that shows the reluctance of investors to sell off their holding in anticipation for better prices.
Forecast
The 21 day MA is above the 7 day MA that signaled a further downtrend. If the price breaks the support level $0.05547, traders could go short and take profit at $0.054000.
Stellar (XLM/USD)
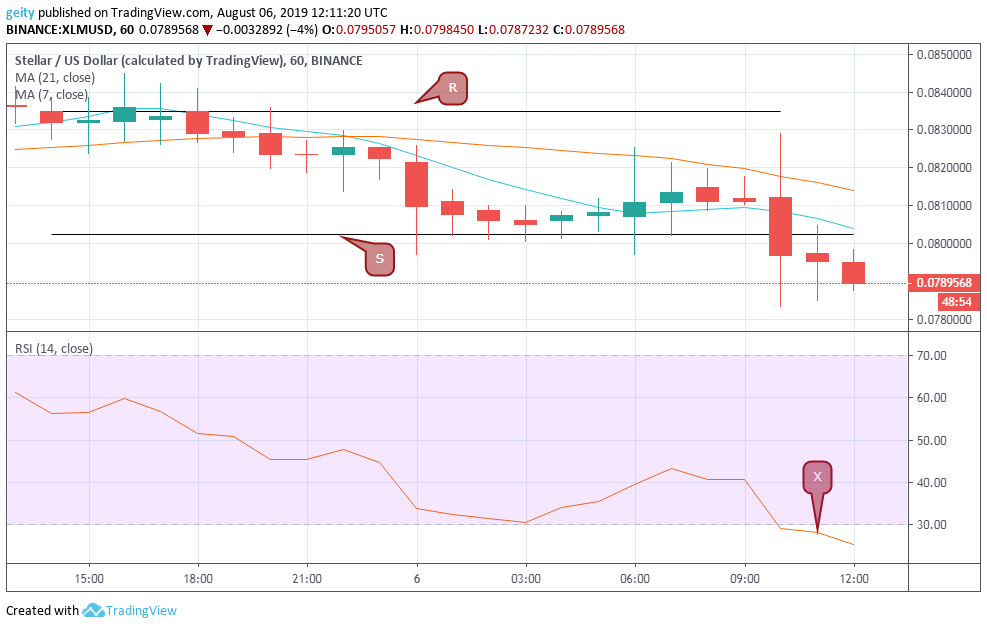
Like ADA, XLM/USD pair has overseen a slow dip. XLM has an intraday dip of 0.5%, having moved from $0.08314 to $0.07896. The support zones have been lowered down from $0.08283 to $0.08349 whereby the support level $0.08349 has been broken, which reflected an increase in bearish pressure.
The Relative Strength Index indicator has also moved south ways from a high of 62 and is currently trading below the oversold zone that signaled an increase in sell-offs. This supports a downward rally if the bulls cannot get up their move. Notably, the increase in the sales of XLM was to the tune of $100 million with a market capitalization of $1.5 billion in the last 24hrs.
Forecast
All the indicators point at the further downtrend, the 21 day MA is currently above the 7 day MA, and the RSI is seen below level 30 that signals a negative sign thus a downtrend. New targets should be set at $0.065.
(XRP/USD)
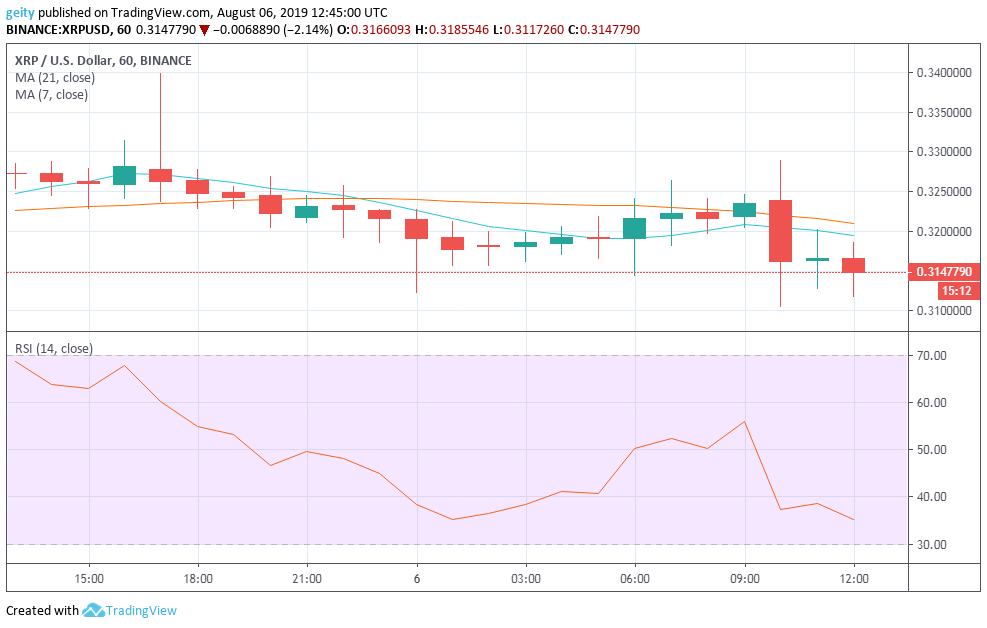
Ripple’s XRP has also exhibited a bearish outlook; XRP recorded a dip of 3.8% over the last 24hrs. Having begun trading yesterday at $0.32729 and is now trading at $0.31477. The bearish price rally has been buttressed by both the moving averages that are moving downwards.
The dip in XRP price has negatively affected investors as reflected by the RSI indicator that massively moved down from the overbought region to currently heading south (oversold territory). This could perhaps be due to reducing confidence in the coin by the investors, thus increase in sell-offs.
Forecast
Now the 21 day MA is dominantly above the 7 day MA that indicates more bearish pressure. New targets should be set at $0.30.


