

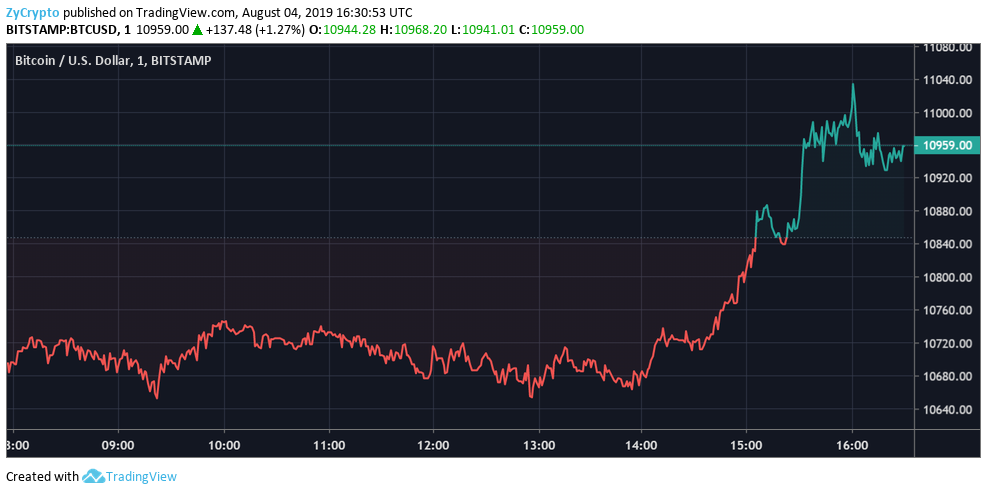
Bitcoin, the most expensive cryptocurrency is now trading upwards after wallowing in a downtrend for most of July. From August 1, 2019, the cryptocurrency experienced significant gains which have landed its price at $10,944, as at press time. However, technical indicators show that the cryptocurrency is approaching an overbought level which could possibly trigger another dip in price.
Bitcoin Gains 3.74 Percent in 24 Hours
A look at Bitcoin’s price chart today shows that the top cryptocurrency by market cap has gained 3.74 percent within 24 hours. Small daily gains of this nature have contributed to moving Bitcoin’s price from the $3,746 it opened at on January 1, 2019, to $10,939 as of today, which is a 190 percent increment in price.
Nonetheless, the virtual asset has suffered a few downtrends here and there and the most recent is an example. For instance, Bitcoin which was priced at $13,129 on July 10, 2019, devalued to $9,163 by July 17, 2019. However, it struggled throughout July to maintain a foothold at the $9000 and $10,000 price levels, with strong support around $9400.
Bitcoin Retraces Upwards in August
On the contrary, the struggle seems to be over given that from August 1, 2019, Bitcoin’s price movement shows that it can potentially trade above $11,000 and even hit $13,000 with ease.
Its resistance currently lies at $11,000, $11,250, $11,500, $12,000, and $12,500. It’s worthy to note that in the short term, a bull run is expected if the asset continues to hold above $10,700. From there on, it could hit its other resistance levels.
While Bitcoin is surging, there’s also a need to point out that its support lies around $10,500, $10,000, $9,800, $9,500. That is to say, if it fails to hold its current resistance around $10,800, there’s a chance that it might reverse to $10,000 and even as low as $9,477. It’s even disturbing to know that if it also fails to hold above $9,477, it could find support at $9,000, $8,638 and $8,256.
RSI Above 50 Shows Bulls Have an Upper Hand in Market’s Momentum
What’s more, RSI (Relative strength index) is currently above 50 which is a good signal that the bulls have an upper hand in the market’s momentum. On the other hand, the Stochastic RSI shows that Bitcoin is approaching an overbought level; a level that could trigger a correction if an asset is priced above its intrinsic value.
Despite what the charts and technical indicators are saying today, the sentiment in the market shows that a number of people are betting hard on Bitcoin. They are bullish that its spike to $16,000 and even higher will be a breeze. Changpeng Zhao, Binance’s CEO recently stated that anyone who had sold their Bitcoin while it traded under $10,000 needs to slap themselves as a reminder for next time.


