
, and Electroneum (ETN)")
BCH/USD
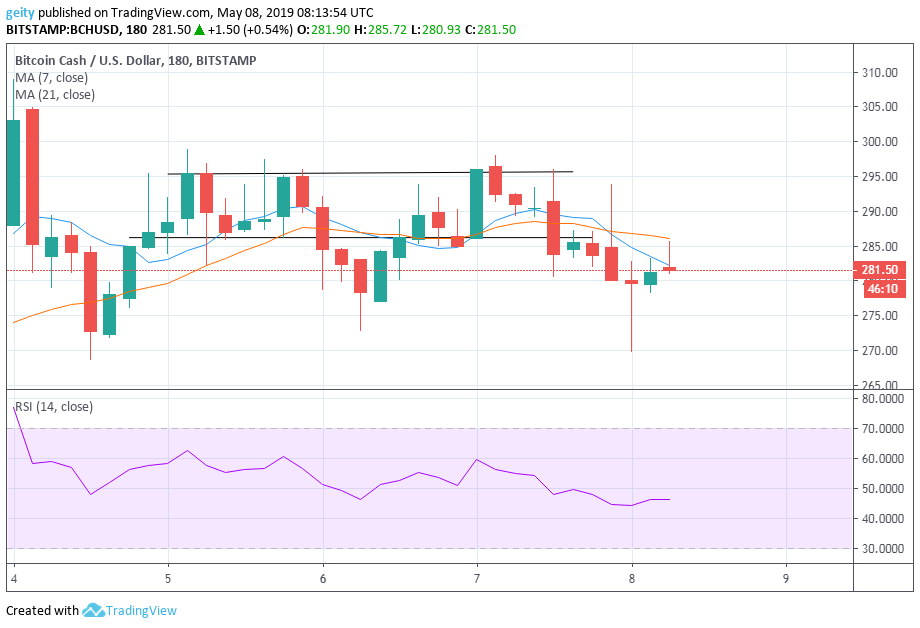
The moving averages have been intertwined in the last 24hrs thus confirm the price momentum is likely in a range. The RSI indicator was above 70 indicating an overbought market from 4th to 6th. On 4th, there was a bearish engulfing pattern which shifted the trend down to a low of $268.51.
This was then followed by a bullish move leading price momentum to a high of $298.90 thus placing resistance level at $295.73 and support level at $284.39 where support level can also be resistance level due to falling of prices at support zone.
Around 6th May the 7 day MA dropped below 21-day MA indicating a buy signal leading the trend to shift up. Later on around 7th May, the 7day MA rises above 21-day MA indicating a sell signal resulting in the trend shifting down.
The BCH has decreased in price with 0.43% since it started trading at $287.90 and is currently trading at $285.98. Currently, the trend has slowed down to an immediate reversal due to the presence of a doji candlestick pattern.
FORECAST
Both moving averages are pointing south also by the use of parabolic SAR indicator the dots are above the prices, this clearly shows that the price momentum will fall resulting in a downtrend in the coming days.
Binance Coin – (BNB)
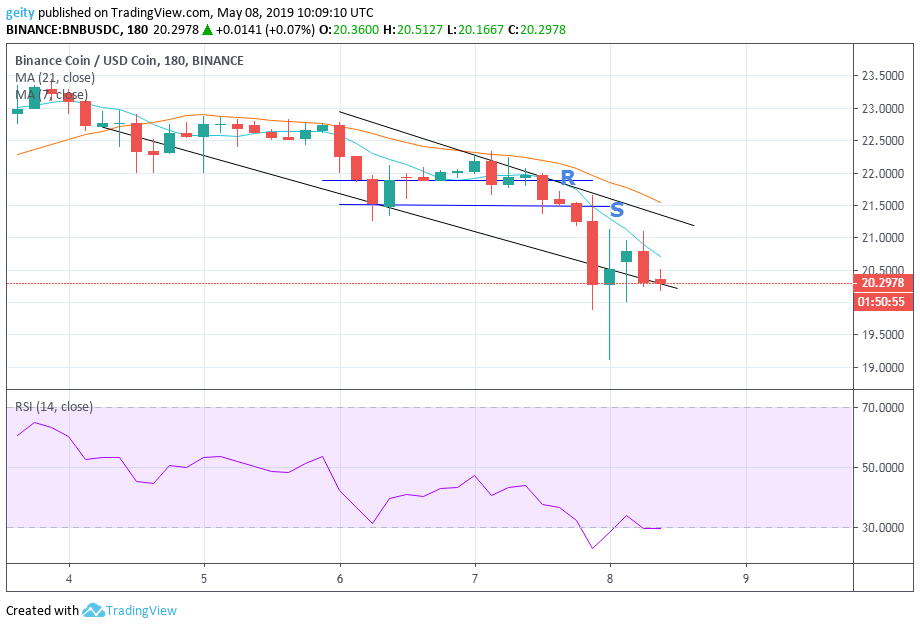
A bearish outlook is seen resulting in a downtrend in the last 24hrs. BNB/USD pair began trading at $23.4013 and is currently trading at $20.34 this shows that it has dipped by 2.28% resulting to increase buy out by investors.
The day began with massive indecision in the market, where sellers and buyers couldn’t decide what move to go next but later on sellers manage to drive the price down at $21.48 placing support level at that point and resistance level at $21.88. Consolidation followed due to the fluctuation of prices and later pushed the price further down. This was confirmed by the RSI which was seen below 30 at that time indicating oversold in the market.
FORECAST
The 7-day MA rose above 21 day MA around 4th may this resulted to a downtrend and currently, the moving averages are both pointing north showing downtrend in the coming day. The RSI is also seen heading north thus signal a hint that bearish pressure is going to continue.
 Emerges as Top Choice for Investors, Toppling BNB and Ethereum")

