

Resistance levels: $5,925, $6,071, $6,177
Support levels: $5,737, $5,523, $5,200
BTC/USD Medium-term Trend: Bullish
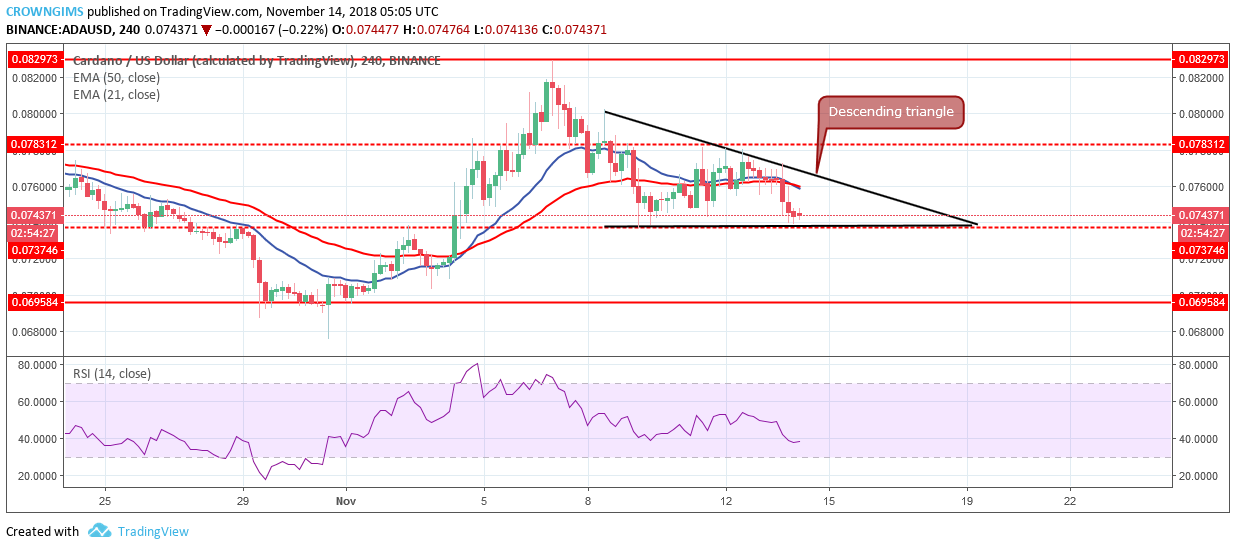

BTC resumes its bearish trend on the medium-term outlook. After many days of consolidation, BTC broke out downward as it was speculated. It is clearly shown on the 4-Hour chart the high momentum gained by the bears; the first bearish engulfing candle that emerged from the ranging zone followed by massive strong bearish candles that broke downside the former support levels of $6,320, $6,177, $6,071, $5,925. The bears were in control of the BTC market
BTC is currently on the support level of $5,637 with the bullish pin bar on the support level which is an indication that the bulls are gradually increasing their momentum, defending this support level which may reject further decrease of BTC price and the price may bounce from this level. In case the bears refuse to let support level of $5,637 hold, it will continue its downtrend in which it may have $5,423 as it target
BTC price is below the 21-day EMA and 50-day EMA with the price far away from the two EMAs indicating downtrend movement is ongoing. Moreover, the MACD with its histogram is below zero level and its signal line pointing down indicates a sell signal.
BTCUSD Short-term Trend: Bearish
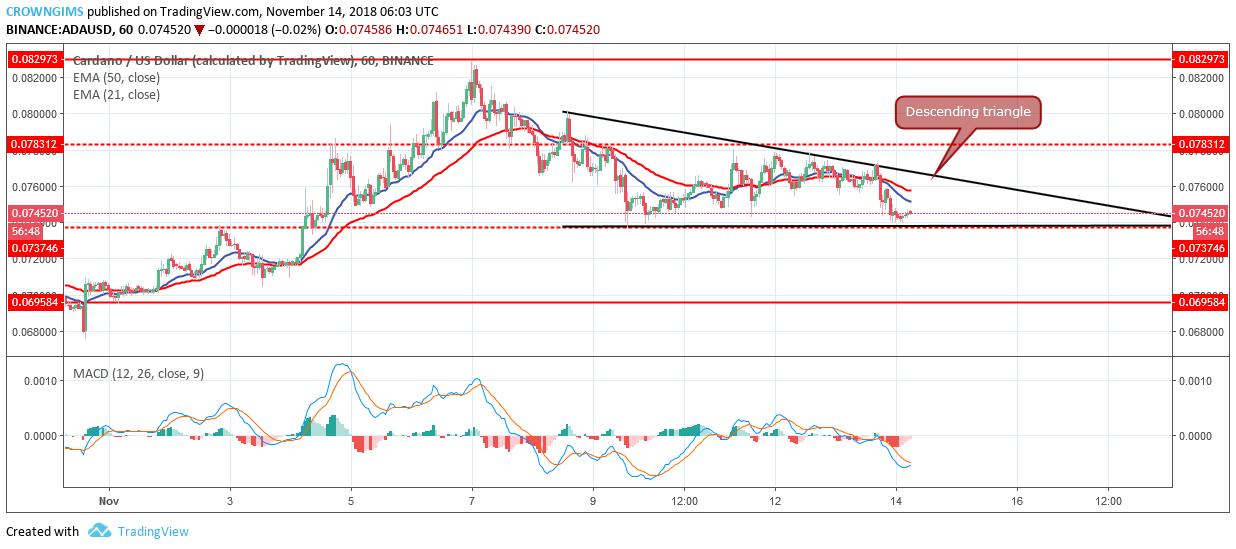
BTC is also bearish on 1-Hour chart. The cryptocurrency was able to break out of the ranging zone which took place for many days. The bears gained momentum and formed bearish candles that led the coin to the low of $5,737
The two EMAs well separated with the BTC price below the 21-day EMA and 50-day EMA indicate that downtrend is ongoing. The MACD period 12, is bringing up its histogram above zero level gradually and its signal lines turning up connotes bulls coming up into the market gradually, which may be price reversal or pull back.

 Price Up 62% From Bottom, Can The Bulls See More Gains?")

