

Resistance Levels: $0.92, $0.98, $1.02
Support Levels: $0.86, $0.080, $0.75
NANO/USD Medium-term Trend: Bullish
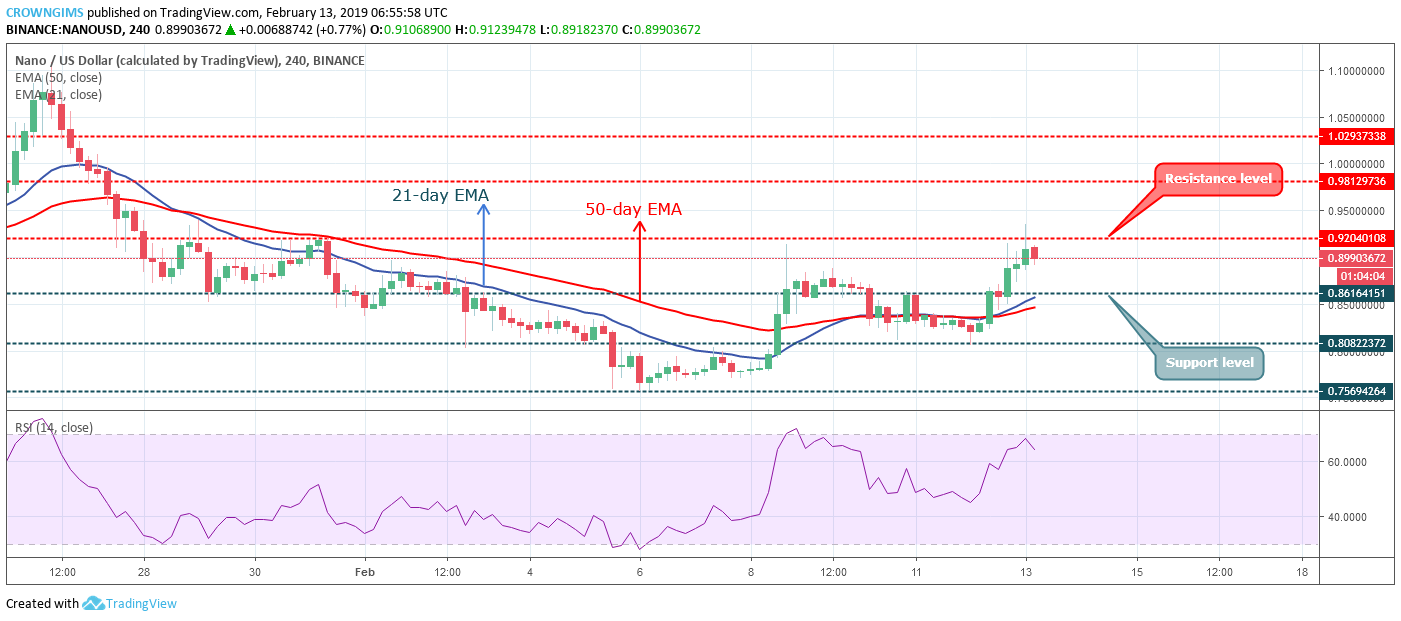
NANO/USD is on the bullish trend on the 4-Hour chart. NANO was under the pressure of the bears for more than ten days started on January 26 at the resistance level of $1.09 and the coin was making lower lows down the market, the bearish momentum was exhausted on February 6 at the support level of $0.75.
NANO price consolidated for a few days, the bulls gained pressure and the coin pushed up to break the resistance level of $0.86 and then rallied towards the $0.92 resistance level where it was rejected to carry out pullback and then continue its bullish trend.
NANO is already exposed to the resistance level of $0.92 and it is currently trading above the 21-day EMA and 50-day EMA. The 21-day EMA is crossing the 50-day EMA upside confirming the upward movement of the coin. The Relative Strength Index period 14 is above 60 levels with the signal line pointing downward which implies a sell signal.
The increase of the bullish momentum will lead to the breakup of the $0.92 resistance level which may place the NANO price at the high of $0.98 resistance level. Should the former mentioned resistance level holds, NANO price will range towards $0.86 – $0.80 price level.
NANO/USD Short-term Trend: Bullish
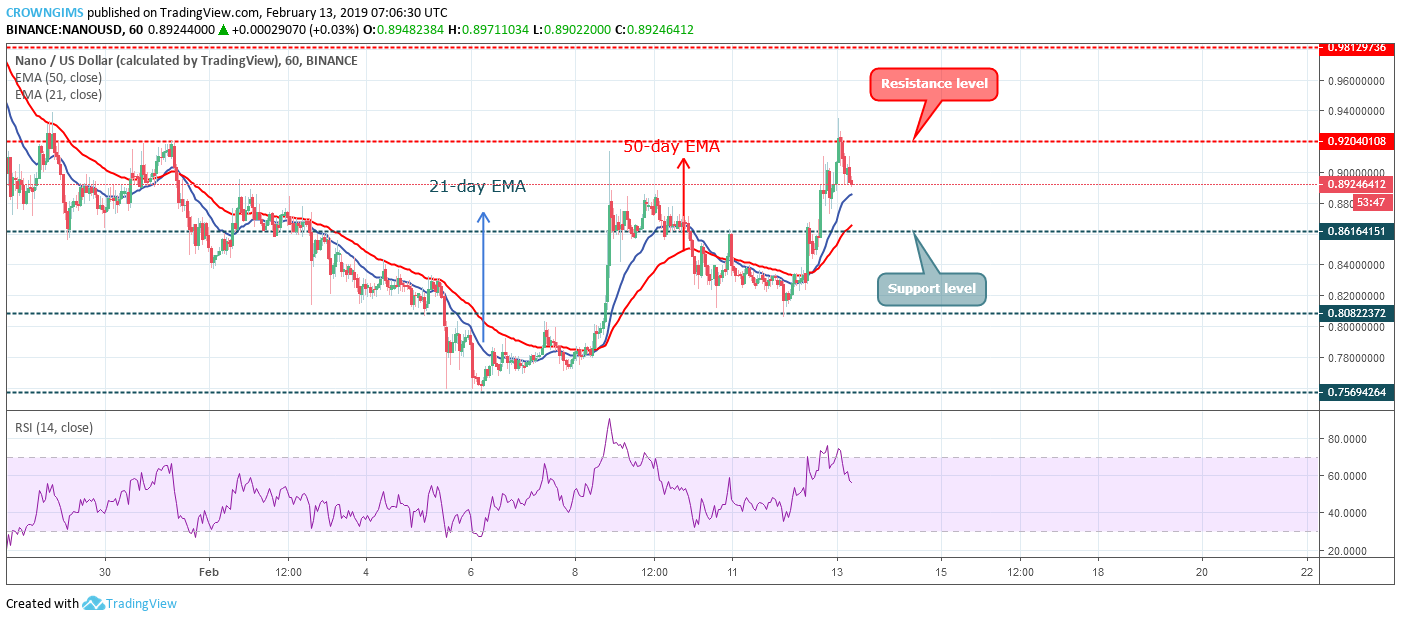
NANO/USD is on the bullish trend on the short-term outlook. Sideways movement on the NANO market started on February 10 – February 12 within the range of $0.86 and $0.80.
The bullish engulfing candle formed triggers the bullish momentum which broke up the $0.86 price level, the coin rallied towards the $0.92 price level but unable to break up the level. As at now, the coin is carrying out price retracement before it resumes its uptrend.
The 21-day EMA has crossed the 50-day EMA upside and the NANO is currently trading above the two EMAs which indicate a bullish momentum on the NANO market. However, the relative strength index period 14 is below 60 levels pointing down which connotes sell signal.

 Price Up 62% From Bottom, Can The Bulls See More Gains?")
