

Supply zones: $0.33, $0.34, $0.36
Demand zones: $0.31, $0.29, $0.27
XRP/USD Medium-term Trend
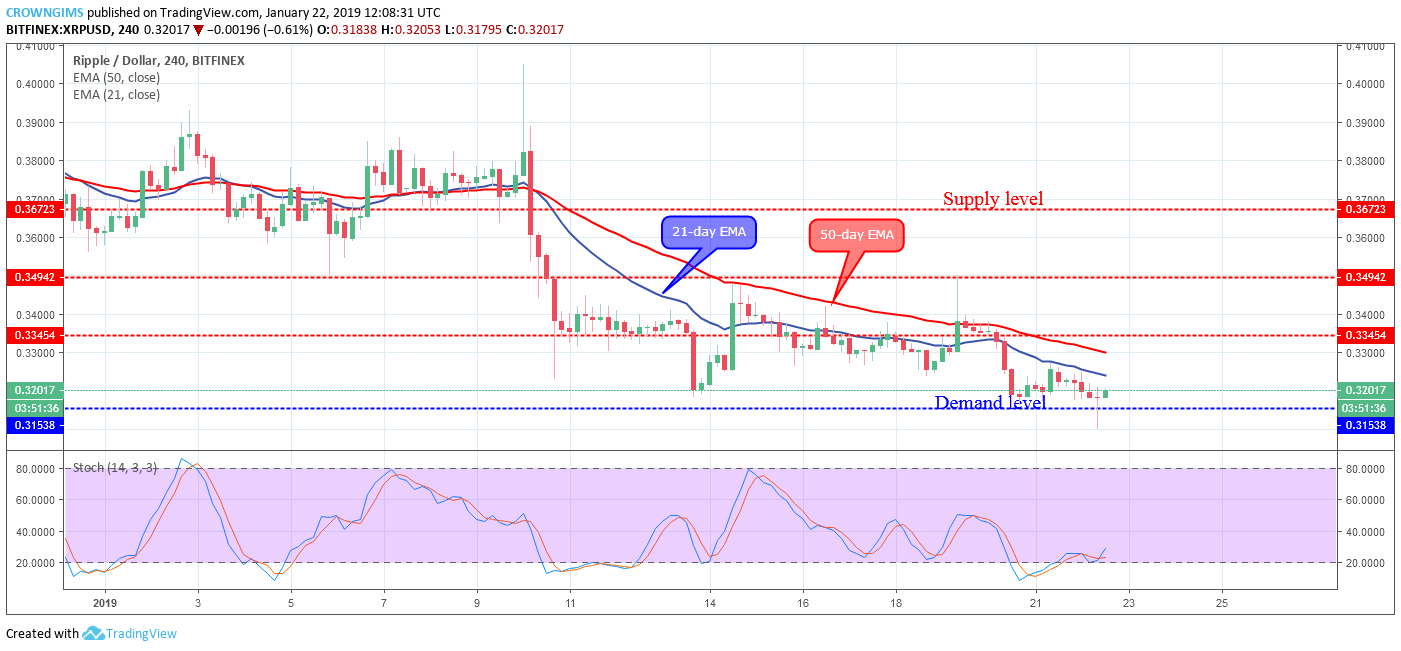
The bearish trend continues on the medium-term outlook in the XRP market. The bears have been holding tight to the XRP market since January 10 And found its support at $0.31 demand zone on January 13.
The inside bar candle pattern formed at the $0.31 level indicates the incoming of the bulls into the XRP market. The bullish momentum pushed the coin towards $0.34 price level after broken up the supply level of $0.33. The dynamic resistance of 50-day EMA resisted further increase in price and the cryptos made lower lows movement to its previous low of $0.31 on January 20 where it is currently ranging.
The Bears ability to breakdown the $0.31 demand level will expose the XRP/USD to $0.29 demand level. Should the bulls defend the $0.31 demand level; the coin will range towards $0.33 – $0.34 supply level.
The 50-day EMA is above 21-day EMA while XRP is trading below the two EMAs. Meanwhile, the Stochastic Oscillator period 14 is at 20 levels (oversold region) with the signal lines bending upward which connotes buy signal and that the XRP price may reverse.
XRP/USD Short-term Trend
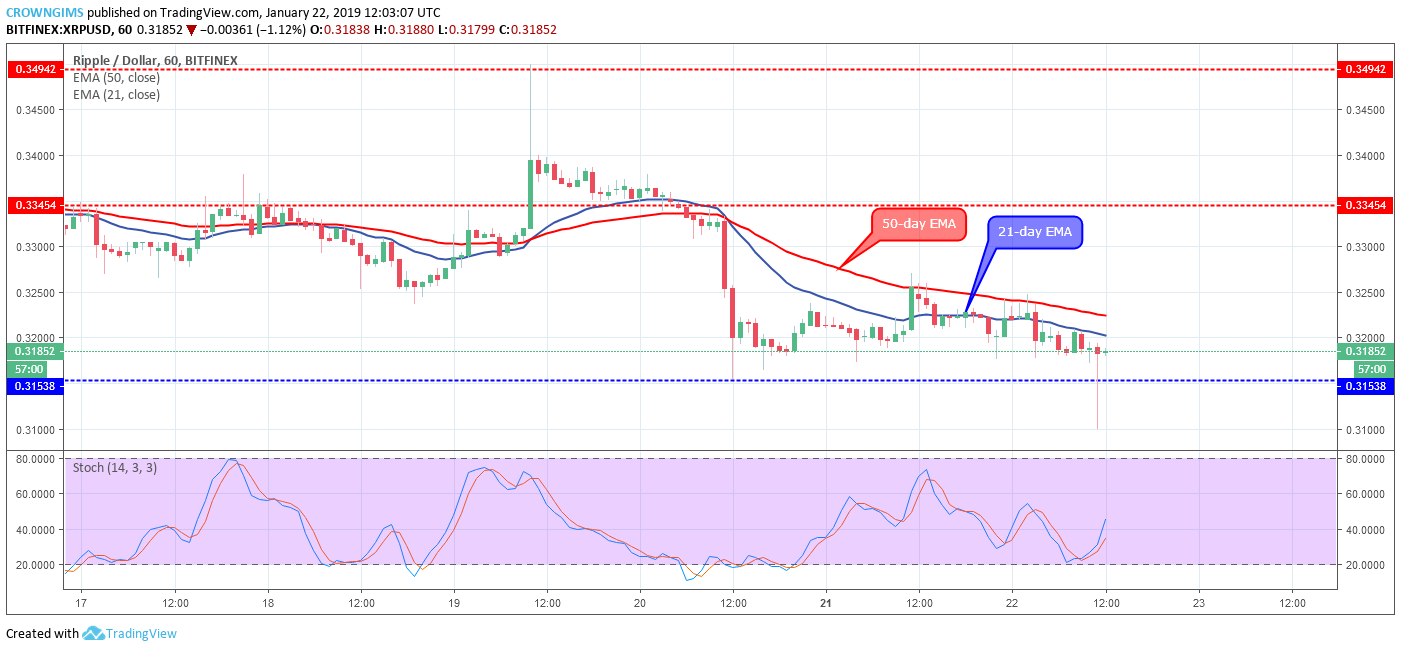
XRP/USD is on the bearish trend on the medium-term outlook. The $0.33 supply level could not hold as the strong massive bullish candle penetrated the level and pushed the coin to the supply level of $0.34 where the price increase was interrupted and the XRP price fell back to $0.31. The coin is currently moving sideways in and out of the two dynamic resistance.
The XRP price is currently facing the demand level of $0.31 with the bearish candle and the coin is trading below the 21-day EMA and 50-day EMA which indicates the increase in bearish pressure in the XRP market. The stochastic Oscillator period 14 is at the 40 levels with its signal line pointing upward which connotes buy signal.


