
, Binance Coin (BNB) and Bitcoin Cash (BCH) Technical Analysis")
A strong Bearish momentum has hit the markets today, with a majority of the coins showing red. This momentum has had the effect of increasing sale offs out of fear of losses by investors. Today’s focus coins performed as follows over the last 24 hours:
XLM/USD
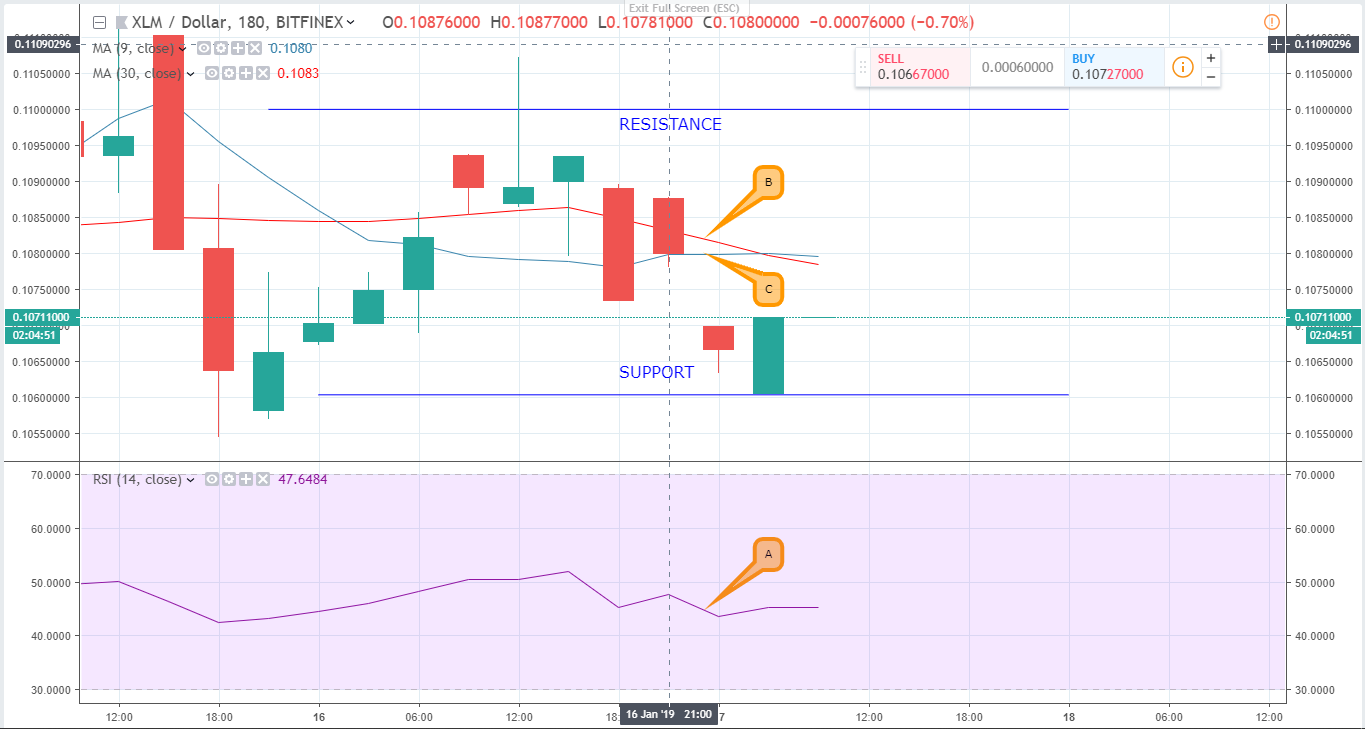
Stellar (XLM) suffered the fate of most other cryptos over the last 24 hours. It started at $0.109 and is now at $0.107 which represents a 1.2% drop. The Bearish trend tested and breached yesterday’s support zone before embarking on a slow upward trend.
The fall in the price of Stellar pushed investors to sell to avoid loss. Consequently, the relative strength Index (A) dropped slightly signaling an increase in buying activity. The 30 days EMA (C) also crossed over the 9 day EMA (B) which indicates that the drop will go on in the short term.
BNB/USD
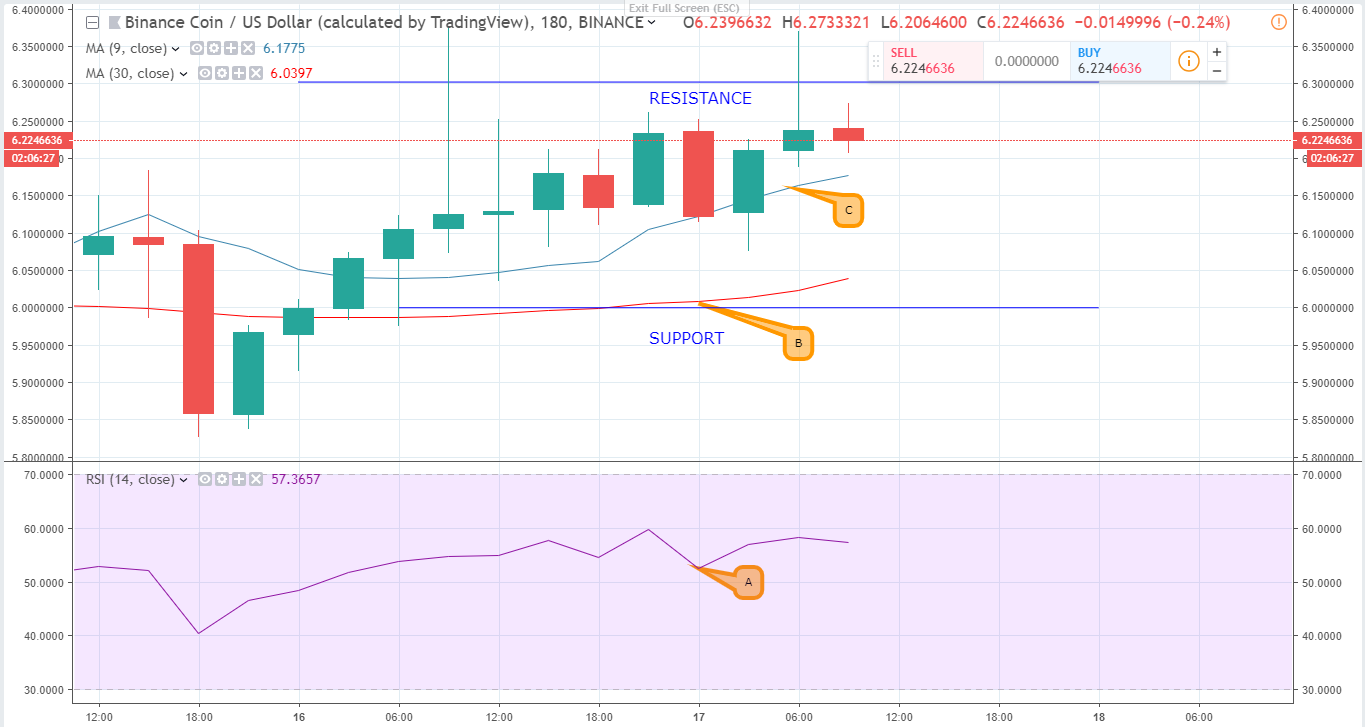
Binance Coin started on a Bullish momentum after it was announced that the EUR/GBP pair would be added on the Binance cryptocurrency exchange. This was to capitalize on the Brexit vote so that the Great Britain Pound (GBP) would become easily exchangeable to Ethereum, Bitcoin or the Euro (EUR).
The short term effect of the above fundamental news was a drop in Binance Coin’s Relative Strength Index (A). This signals increased buying activity as well as increased investor confidence in the coin. The RSI is currently at 58. This is closer to 70 (overbought) than 30 (undersold). This means that the strong investor confidence has taken a dip which has created a slow Bearish run.
Binance Coin has taken a small, 1.1% drop as a result of increased sale offs. The 9-day moving average (B), has gone under the 30-day moving average (C). This shows that a bearish momentum has hit the markets and its likely Binance coin will take a dip unless the Bulls up their momentum.
BCH/USD
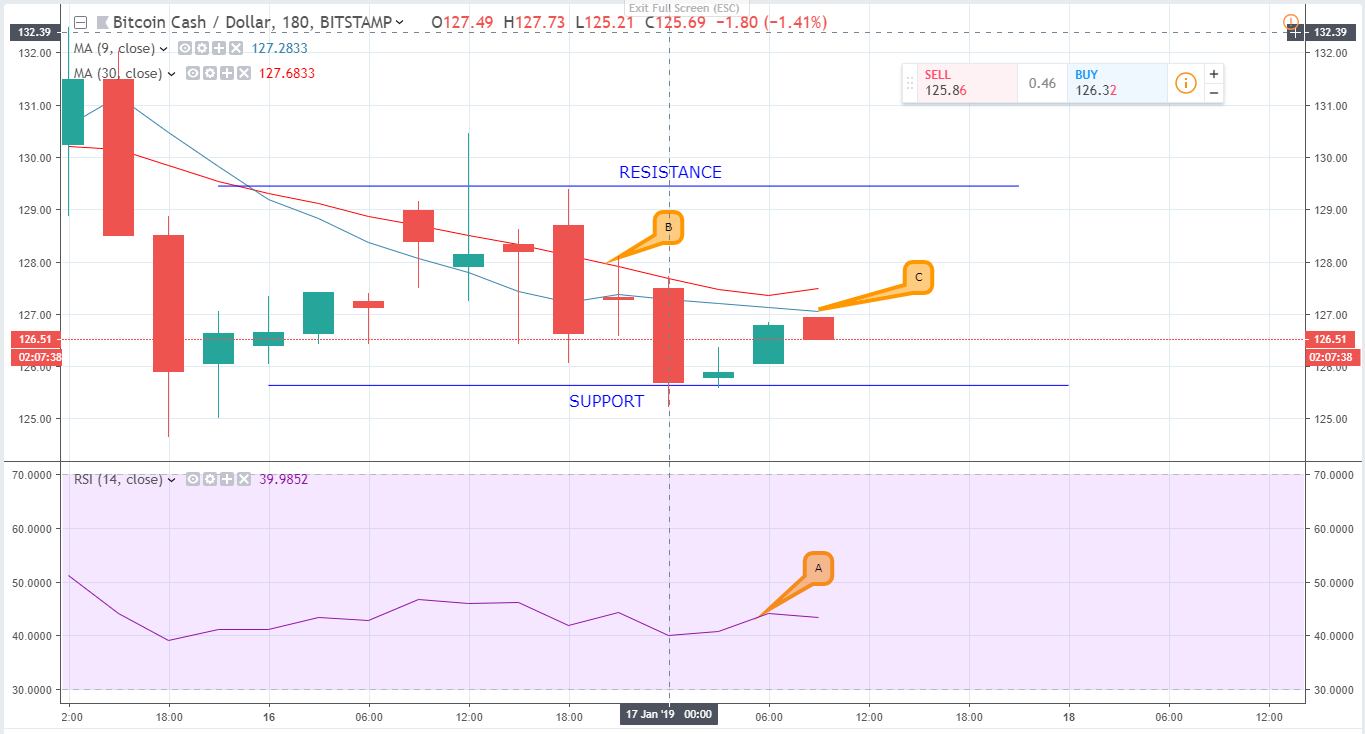
The post fork period for Bitcoin Cash has been tumultuous. In the first week of 2019, it looked as if the Bulls would take charge of the market. However, the Bears have dominated the market with the 30-day moving average currently acting as price support at $130.53. This indicates a Bearish period is incoming.
In the markets, BCH is down by 2.03% with a market capitalization of $2.3 Billion. In the last 24 hours, BCH had a market volume of $181 Million.
 Emerges as Top Choice for Investors, Toppling BNB and Ethereum")

